About LBJ Data Studio > Session 2 - Exploratory Analysis
Session 2 - Exploratory Analysis
Using R to ask and answer questions about your data
September 24, 2021
Overview
This is an overview of the September 24th session of LBJ Data Studio. Ethan Tenison led today’s session and Matt supported participants for the duration of the session.
- Ethan Tenison: tenison.ethan@austin.utexas.edu
- Matt Worthington: matthew.worthington@austin.utexas.edu
LBJ Studio Dates + Formats
Below are the dates and formats of the session. Our original plan was to eventually hold these in-person, but they will be held on zoom for the first few sessions. The session referenced on this page is highlighted in bold.
- Zoom Session: Sep 10, 2021 at Noon
- Zoom Session: Sep 24, 2021 at Noon
- Zoom Session: Oct 8, 2021 at Noon
- In-person: Oct 22, 2021 at Noon in Room 3.124 at the LBJ School
- TBD: Nov 5, 2021 at Noon
- TBD: Nov 19, 2021 at Noon
- TBD: Dec 3, 2021 at Noon
What’s Covered In This Session
For this session, we focused on the following topics.
- Navigating Rstudio
- Useful keyboard shortcuts
- Using R Markdown for EDA Analysis
- Using
dplyrto work with data - Revisiting
ggplot2
Session Materials
Github Materials
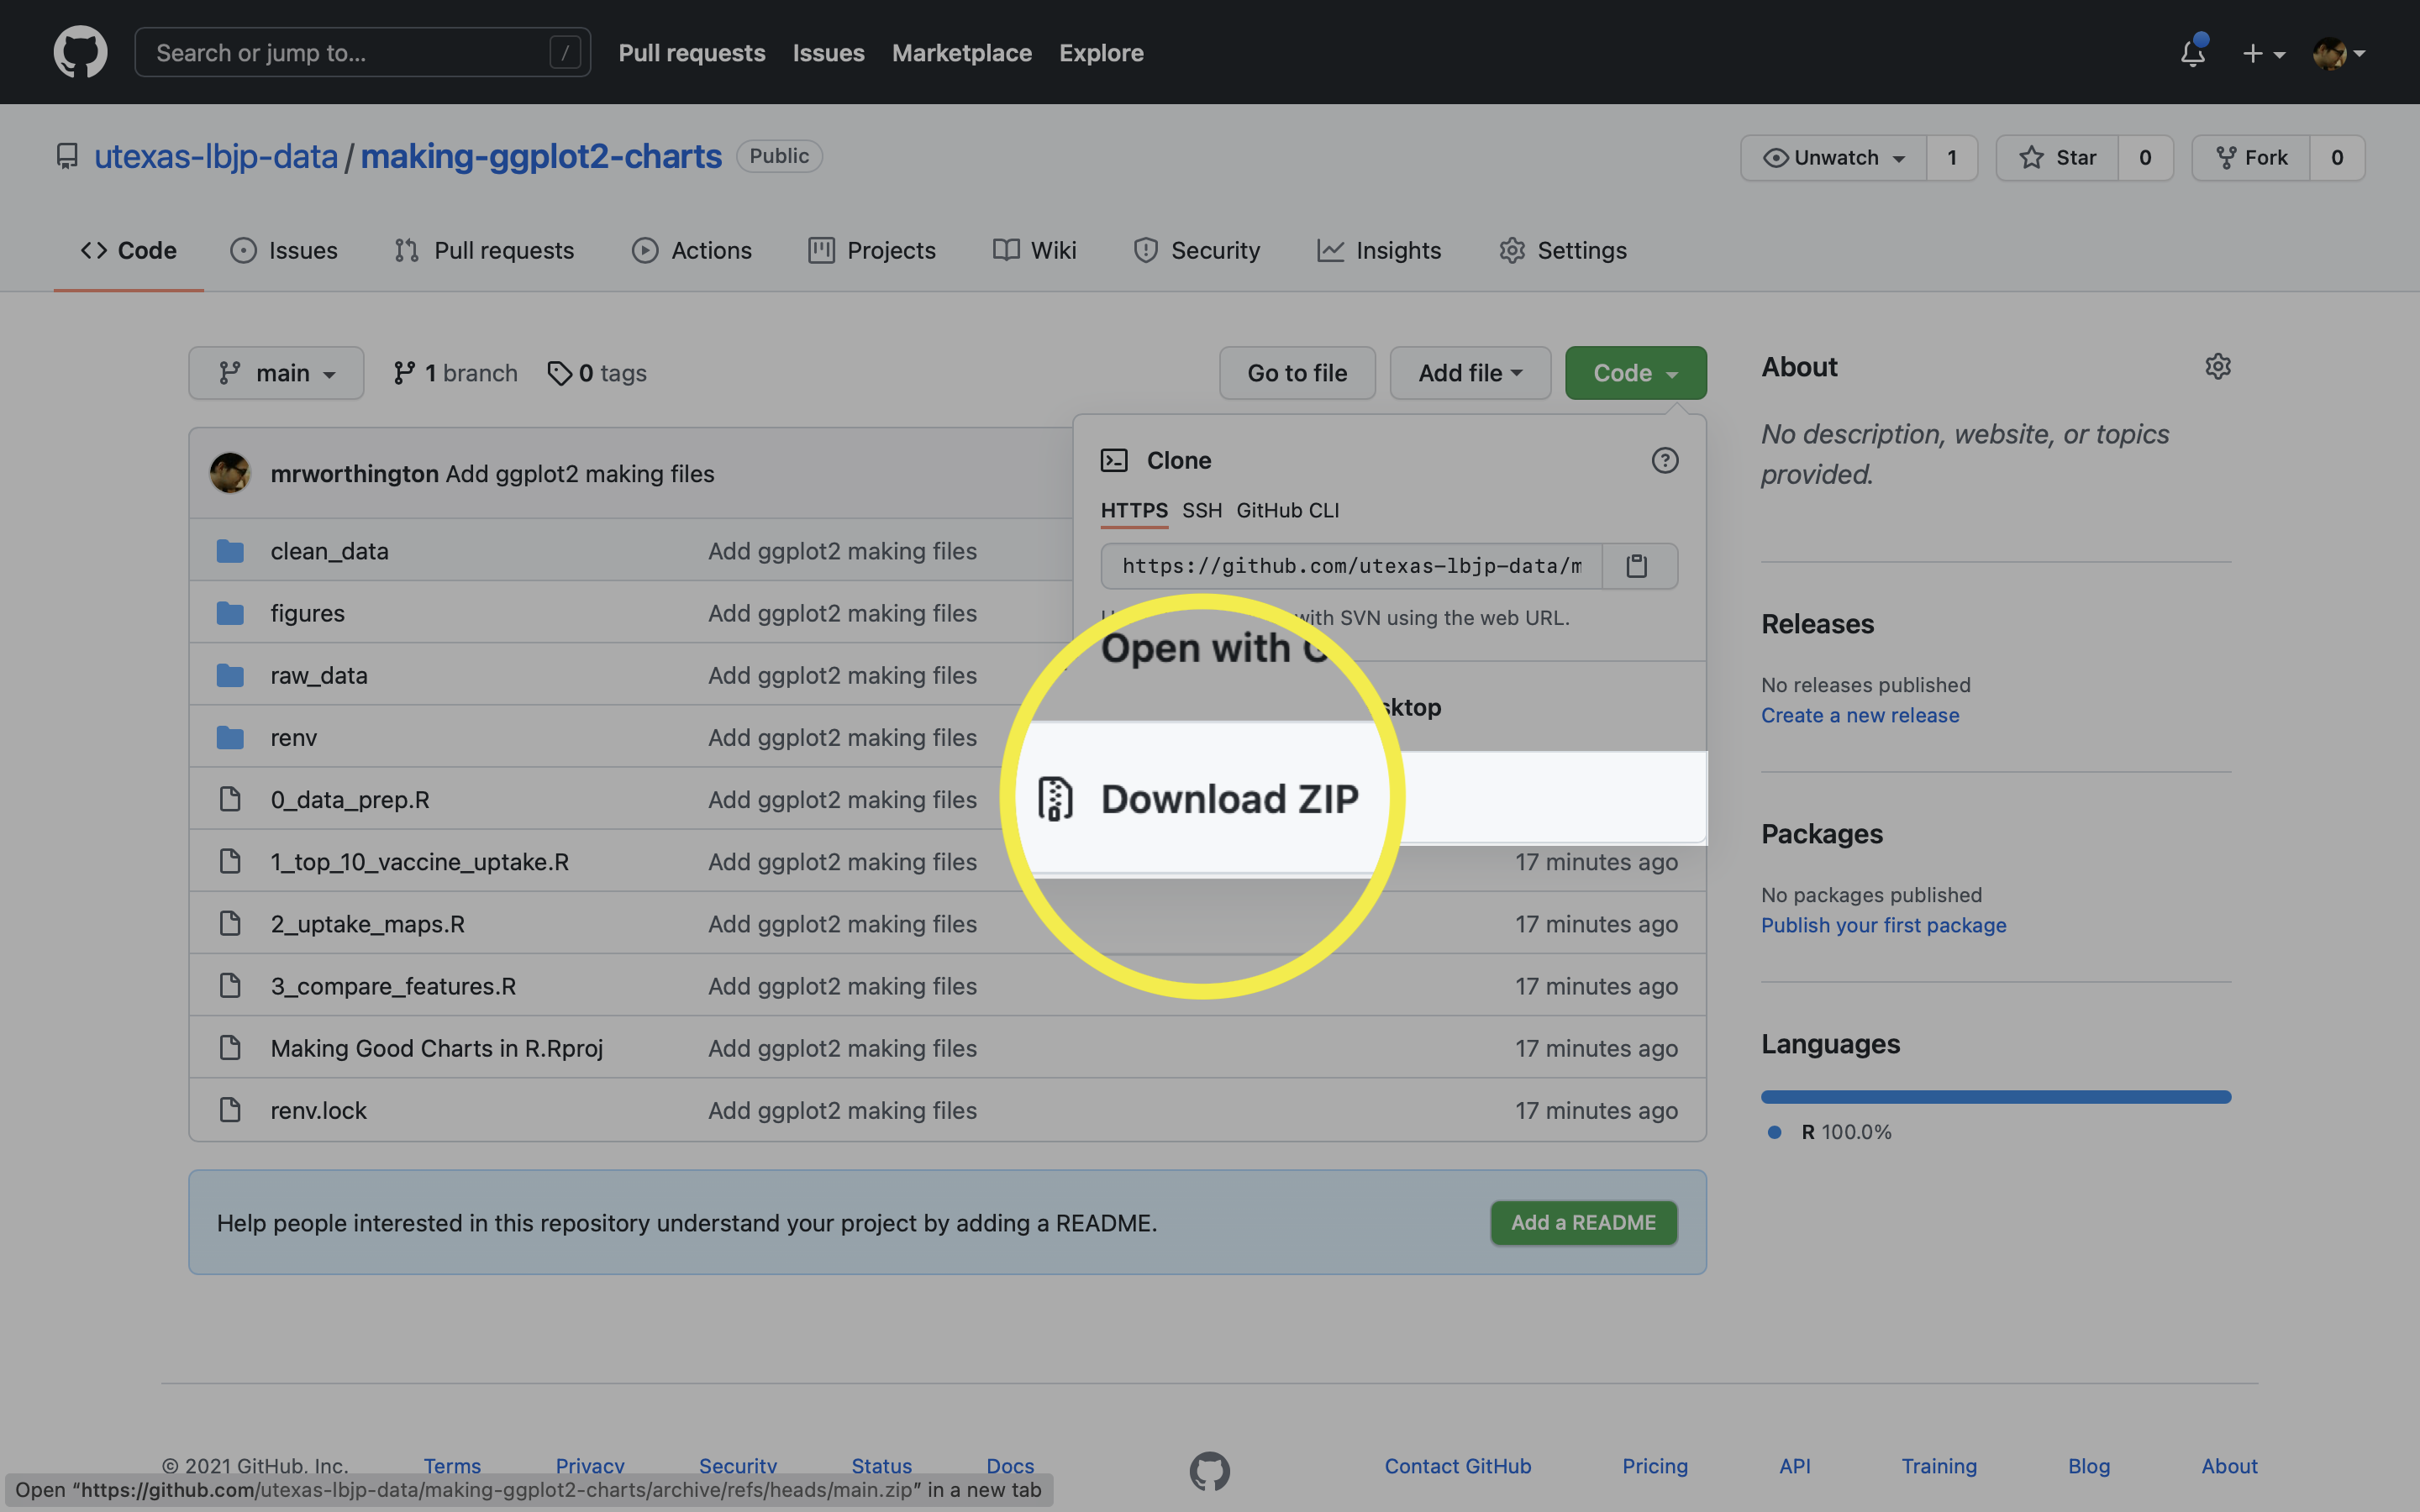
Below is a link to the materials used during the session. Participants followed along with the materials in the slides using the series of R Scripts below. To download the materials, you’ll need to visit Github and download from there (see screenshot below). Once downloaded, place the files in a location on your computer (example: the desktop or documents folder).
Note for Windows users: will want to make sure to extract the downloaded zip before working with the materials.
- Download This Session’s Materials : tinyurl.com/making-ggplot2-charts
Reference Materials
Below is a link to learning more about exploratory analysis in R. It won’t cover everything you’ll want to know, nor will every part of it resonate with you, but it will help you in at least some regard. In any event, it’s a great resource that comes highly recommended by folks across the world of R:
- The Session Slides Generally speaking, you shouldn’t expect to remember everything you code or write. Referencing back to materials you’ve already viewed or read is very common when coding. Over time, certain things will get easier to remember, but having slides like these helps in a pinch.
- #rstats hashtag on Twitter People share a ton of great material for R users of every skill level on Twitter. If you’re looking for inspiration and want to see what code people used to make a specific chart, this is the spot to do it. For additional R resources outside of ggplot2, use the #rstats.
- Chapter 7 of R For Data Science R for Data Science is a phenomemal book for anyone wanting to learn how to use R + the Tidyverse from scratch. Chapter7 specifically focuses on Exploratory Data Analysis and has tons of exercises that work with the basic install of RStudio, R, and the tidyverse packages. There’s also a great Slack channel where you can ask roughly ~10k people questions about each of the topics covered by a chapter and get great feedback.
Acknowledgements
Photo by ian dooley on Unsplash